Journey Map
What is it?
A journey map gives an overview of the factors influencing the user experience from a users’ perspective. The journey is mapped over time as the user experiences the product or service. The map can help to identify problem areas as well as opportunities. We use journey mapping to improve existing services or when we designing new services. A journey map is usually made at the beginning of a project. The outcome is a complete overview of all touch points, and can be used to bring focus or to support design decisions. It can also help align stakeholders on a shared vision.
Why use it?
You can use journey maps for lots of different purposes and they can sometimes serve multiple purposes at the same time. Some of the most common purposes are:
- Creating alignment amongst stakeholders about the product/service experience
- Making sense of research data by plotting it in a journey map and giving it an interpretation
- Defining focus/priority for a project
- Identifying problem/opportunity areas in a service
- Designing a new service
When to use it?
Create a journey map in the discovery phase. This way you capture the current knowledge and assumptions. You can then validate those with research and data, set a scope for the project and proceed to the next phase of the design process.
What do you need
Tools
Physical workshop
- Post-its (different color per row)
- Brownpaper/whiteboard
- Markers
- Dot-votes
Digital workshop
- Miro/Mural/Sheets/Slides set up to fill in the journey
People
| Role | Accountabilities | Time |
|---|---|---|
| Facilitator | Facilitate workshop and meaningful outcome | 1,5 day |
| Researcher | Gather knowledge from users and experts, analyze data and research, create journey | Depends on kind of map |
| Interaction designer | Support researcher, understand journey to use in design phase, create journey | 1 day |
| Visual designer | Amplify the story of the journey with visual design (only for one-off journey maps) | 1 day |
| Stakeholders | Contribute expert knowledge to workshop, spot and prioritise opportunities | 3 hours |
To create synergy it can help to combine the facilitator, researcher and interaction designer role. The designer is in the perfect position to focus the research and the workshop on the outcome needed for the design process. Of course this requires a designer with a broad and advanced skillset.
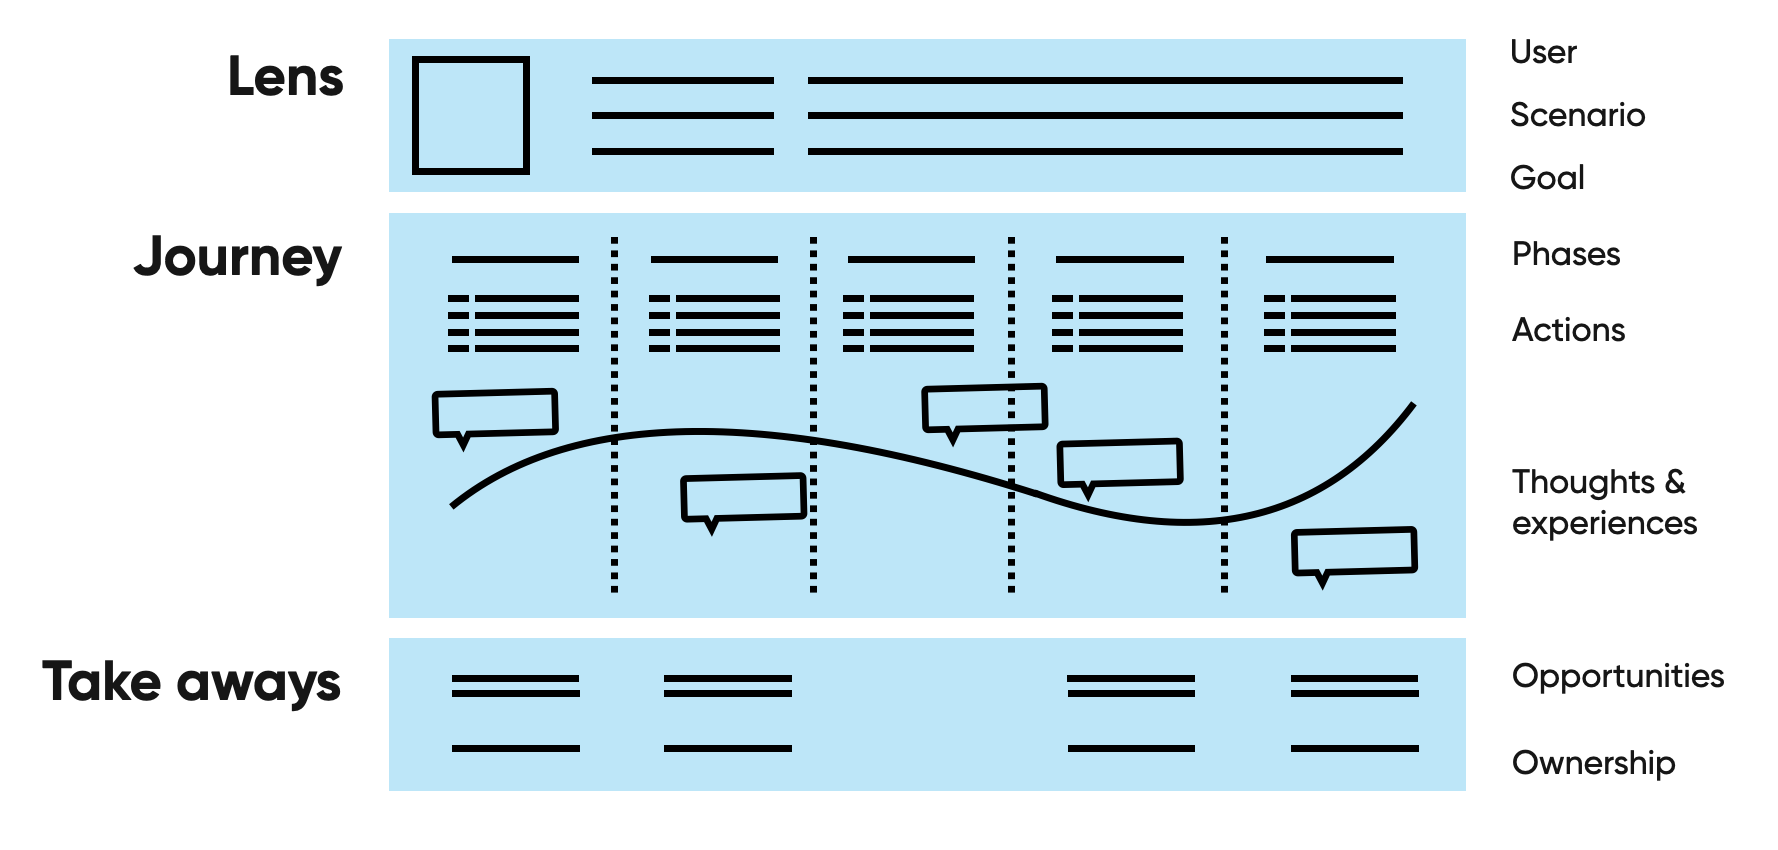
Anatomy of a journey map
**User journey map** or **customer journey map**? They are used interchangeably. In practice, as long as a journey map has a persona that it focusses on, you can name that persona however you like. User and customer are used interchangeably in this article as well.
Current or future state
Before you start creating a journey map, you need to decide if it will be a representation of the current state of the experience or a future state. Mixing these two states is usually a bad idea because it creates confusion. If you do need both states, make sure they have clear visual distinction.
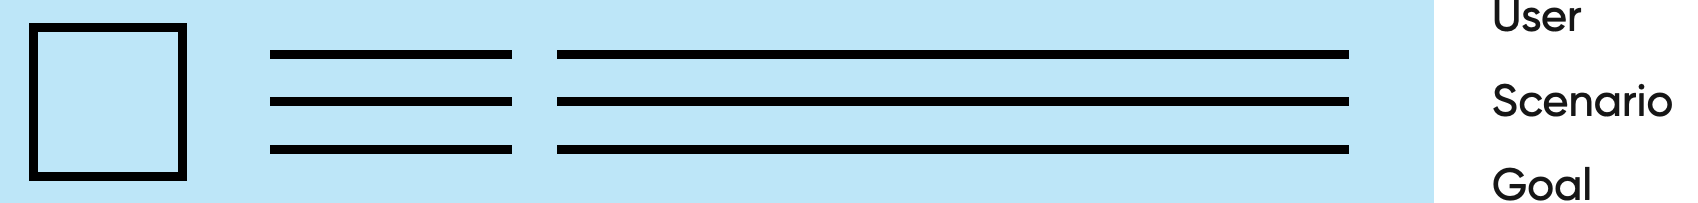
Lens
The lens creates clarity about the scope of the journey you are describing: what is part of it and, more importantly, what is not. Agree on what the lens is before you start your research to make sure the project doesn't get out of hand.
The lens consists of a specific persona that the journey focusses on, the scenario they find themselves in and the goal they are trying to accomplish. The lens is usually found at the top of the map.
Persona
Before creating the persona, think about what is actually relevant to the journey. Usually this means you can omit a lot of parts from a regular persona (hobbies, age, favourite apps/devices/brands). However, this completely depends on the product or service you are mapping. The goal here is to make the most important assumptions about the persona's characteristics explicit. Usually psychographics are the most relevant:
- Attitudes
- Personality & values
- Behaviour
**Multiple personas?** Create multiple maps or integrate them smartly into one. If the journeys overlap, it makes sense to integrate the journeys. If they don't it is often better to keep them apart for the sake of clarity.
Scenario and goal
The goal of describing the scenario and goal are to make the scope of this map explicit. Do not make the scope too big and make sure there is little room for interpretation of what is in scope and what is not. If you do not do this, you will end up in hours long mapping sessions with huge maps that create little clarity (speaking from experience here).
Define these two things clearly in the scenario and goal:
- The situation/context and the user's need
- The domain of the journey: it's starting point and end point
**Future state lenses** can also include an empathy map, value proposition canvas and other conjectures that define the 'to-be' product and user.
Journey
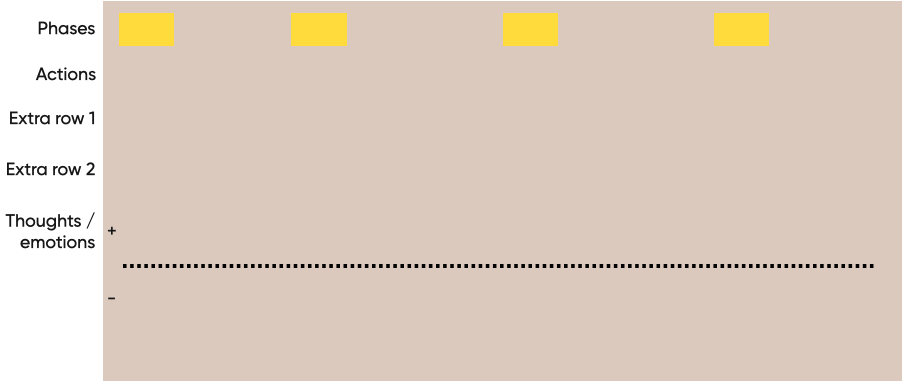
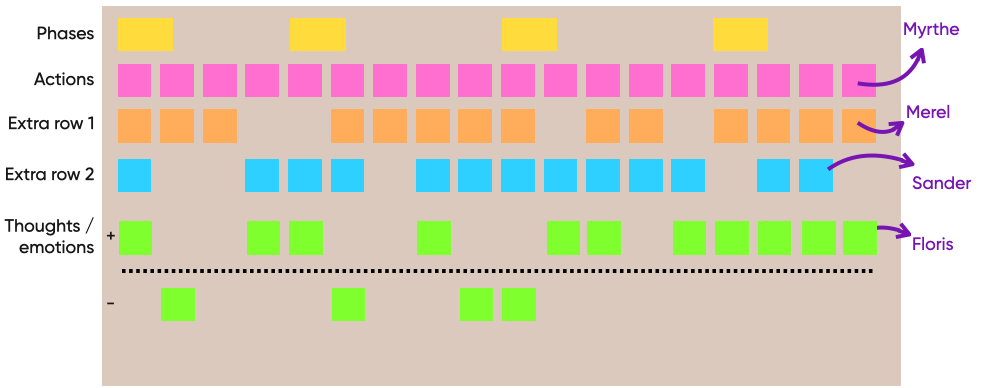
The journey consists of rows that describe the different elements in the experience of the user (actions, thoughts, emotions, etc.), and of columns that describe the phases using the elements of the experience.
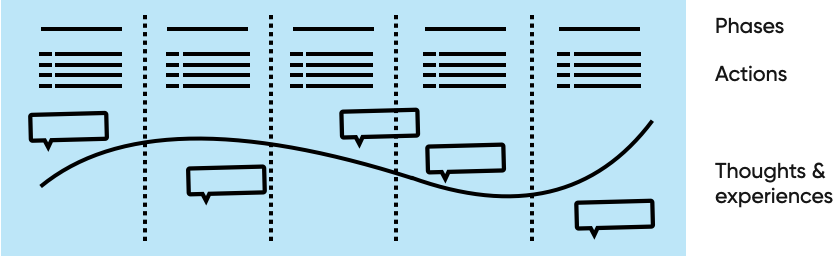
Phases
The phases of a journey are the broad categories in which you can capture the actions a user takes to reach their goal. Usually a journey has between 3 to 8 phases. Examples of phases are: discovery, research, order, usage, after service or awareness, consideration, acquisition, service and loyalty.
If your list of actions becomes too long you can consider adding an extra phase to regain clarity.
If you are defining the journey with stakeholders, it helps to define the phases beforehand to give them a starting point to fill in the rest of the journey. This also gives you the opportunity to focus on the phases you are most interested in.
Actions
For each phase, define the actions that the user takes. This clarifies what the experiences, thoughts and other experiential data in the phase is about. Even though flows are not the same as maps, it can sometimes be helpful to include a simple flowchart to demonstrate the process of the service. Make sure this does not detract from the clear insights you are trying to convey with the map.
Thoughts and emotions
These are often represented as a curve that shows how positive or negative the emotions are throughout the process, combined with quotes from users that explain why the curve is positive or negative. The purpose of this emotion curve and the thoughts is to tell the story of the user's experience of the product or service. That means that it is an interpretation of the research results. If you have not done research to back this up, than it is a quick way of visualising how you think users experience the product/service.
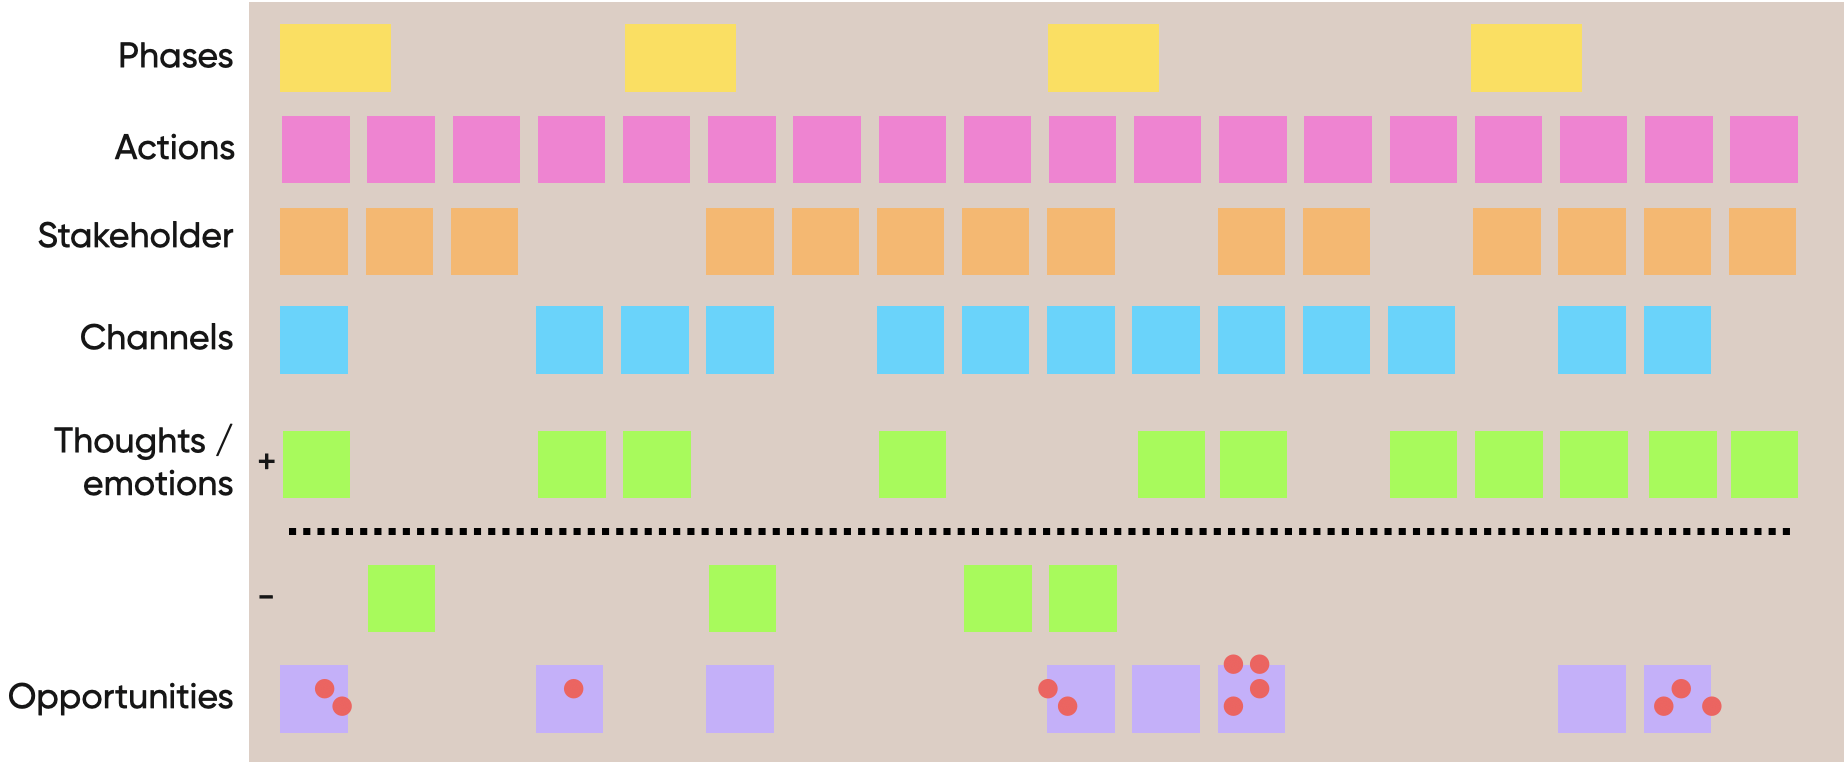
Additional rows
Apart from the three rows described above, it is sometimes useful to include additional rows such as touchpoints, stakeholders responsible, clarifications, screens, background processes (if you want to expand it to a service blueprint). Again, make sure this adds to the story you are trying to tell with the journey map. And align the rows with your main stakeholder to verify that your story is not missing a crucial component.
Take-aways
This is where you highlight what viewers of the journey map should take away from the story. Two common parts are opportunities and ownership.
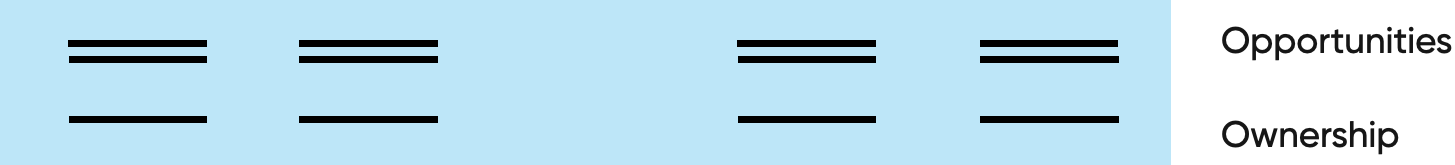
Opportunities
After telling the story of the journey it is important to highlight where the missed opportunities lie and what pain points can be improved. Do this by studying the map, circling opportunities and explaining those opportunities below the journey.
Ownership
Then per opportunity it can be helpful to already distribute ownership between the stakeholders so everyone knows who will pick up what opportunity. Of course this is something that you do not want to do yourself because you often do not have legitimate authority to do this, so make sure you do this together with your stakeholders.
How to create a journey map
Before you start 1: Purpose of the map
Together with your main stakeholder, define what you are trying to accomplish with the journey map. Is it alignment within the team, an overview of assumptions, an inspiring vision of the future, or something else? Make sure a journey map is the right method for this.
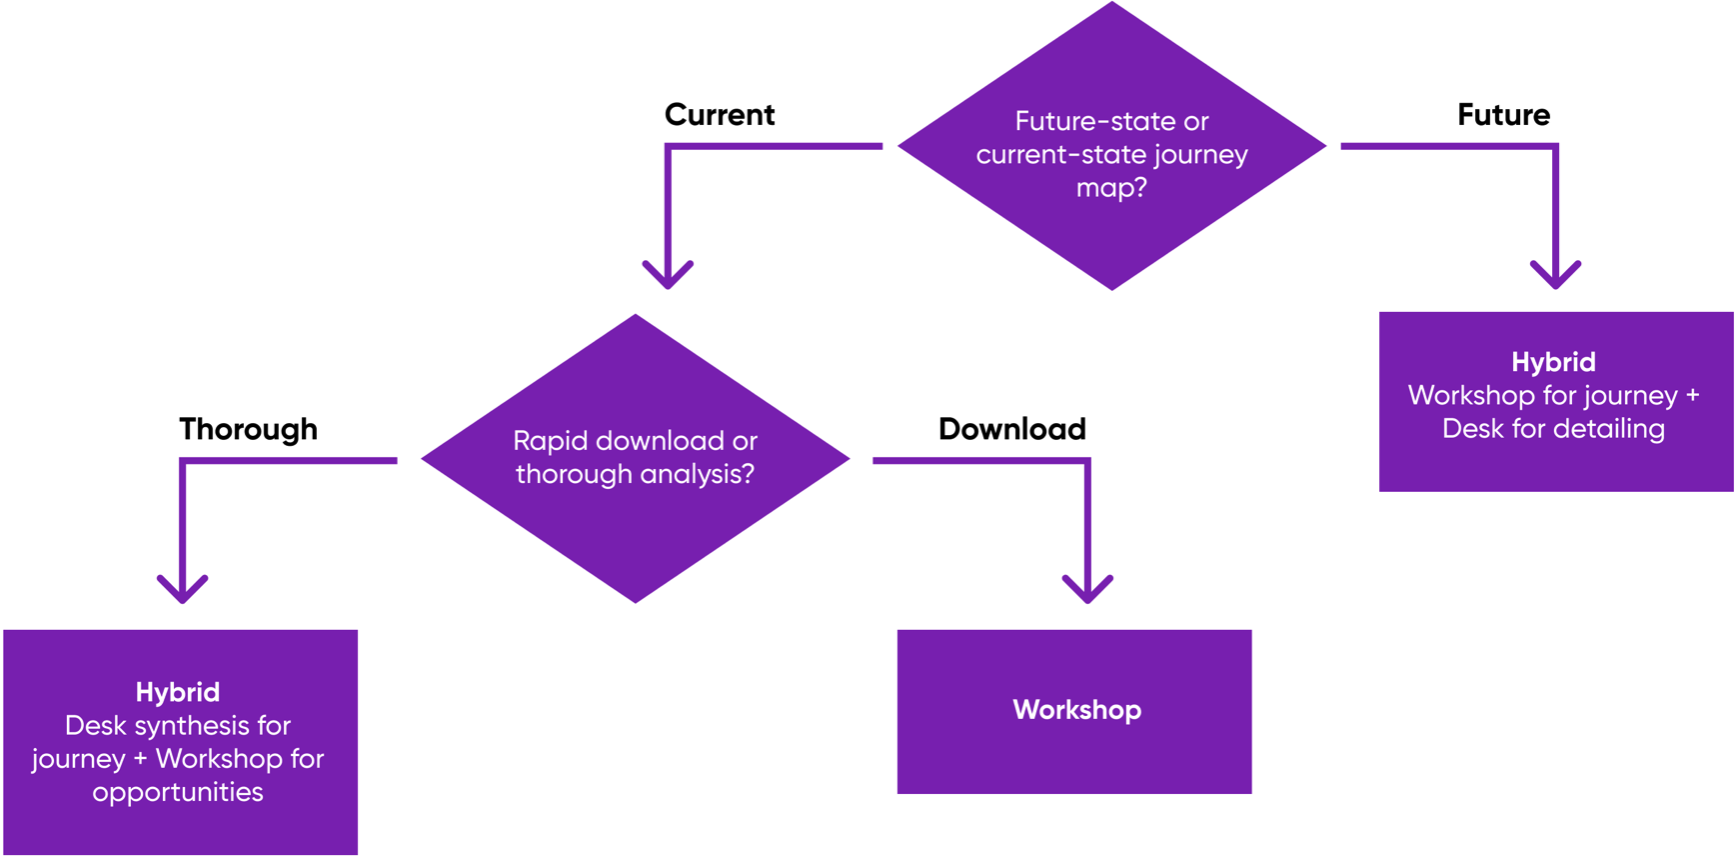
Before you start 2: Desk, workshop or hybrid
Depending on the purpose of your map you can determine who should be involved in making the map. It is almost never advisable to create a map without involvement of stakeholders. However, doing everything in a workshop is also not ideal. This flowchart helps you decide on your approach:
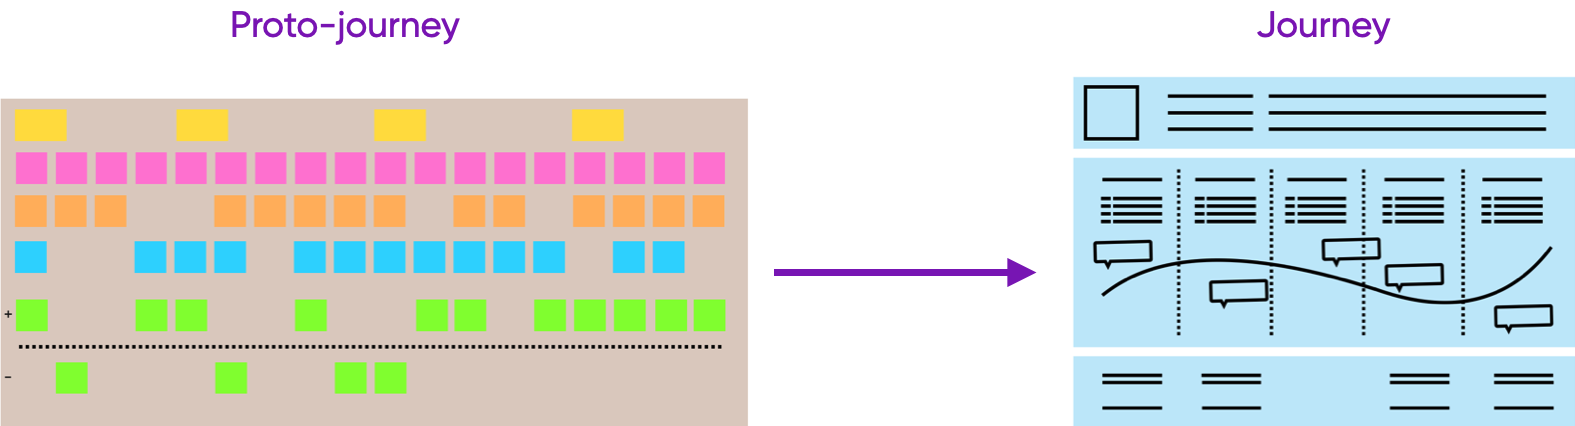
Before you start 3: Proto-journey, research based journey
Depending on how much resources you have and what the aim of your map is, you can also start with a proto-journey. A proto-journey is a low-fi version of the journey map that captures your assumptions regarding the journey. At the very least this can create alignment and understanding, but it is also a very good starting point for creating a validated, research based journey.
Step 1: Data collection
Define the lens
- Create a persona, either by simplifying an existing one for your journey map purposes, by creating one based on your own research or by creating one in a workshop with stakeholders
- Create a scenario and goal that the journey will focus on. Make sure this not too detailed or too broad for the goal of your journey map
- Align these two with the expectations of your main stakeholder
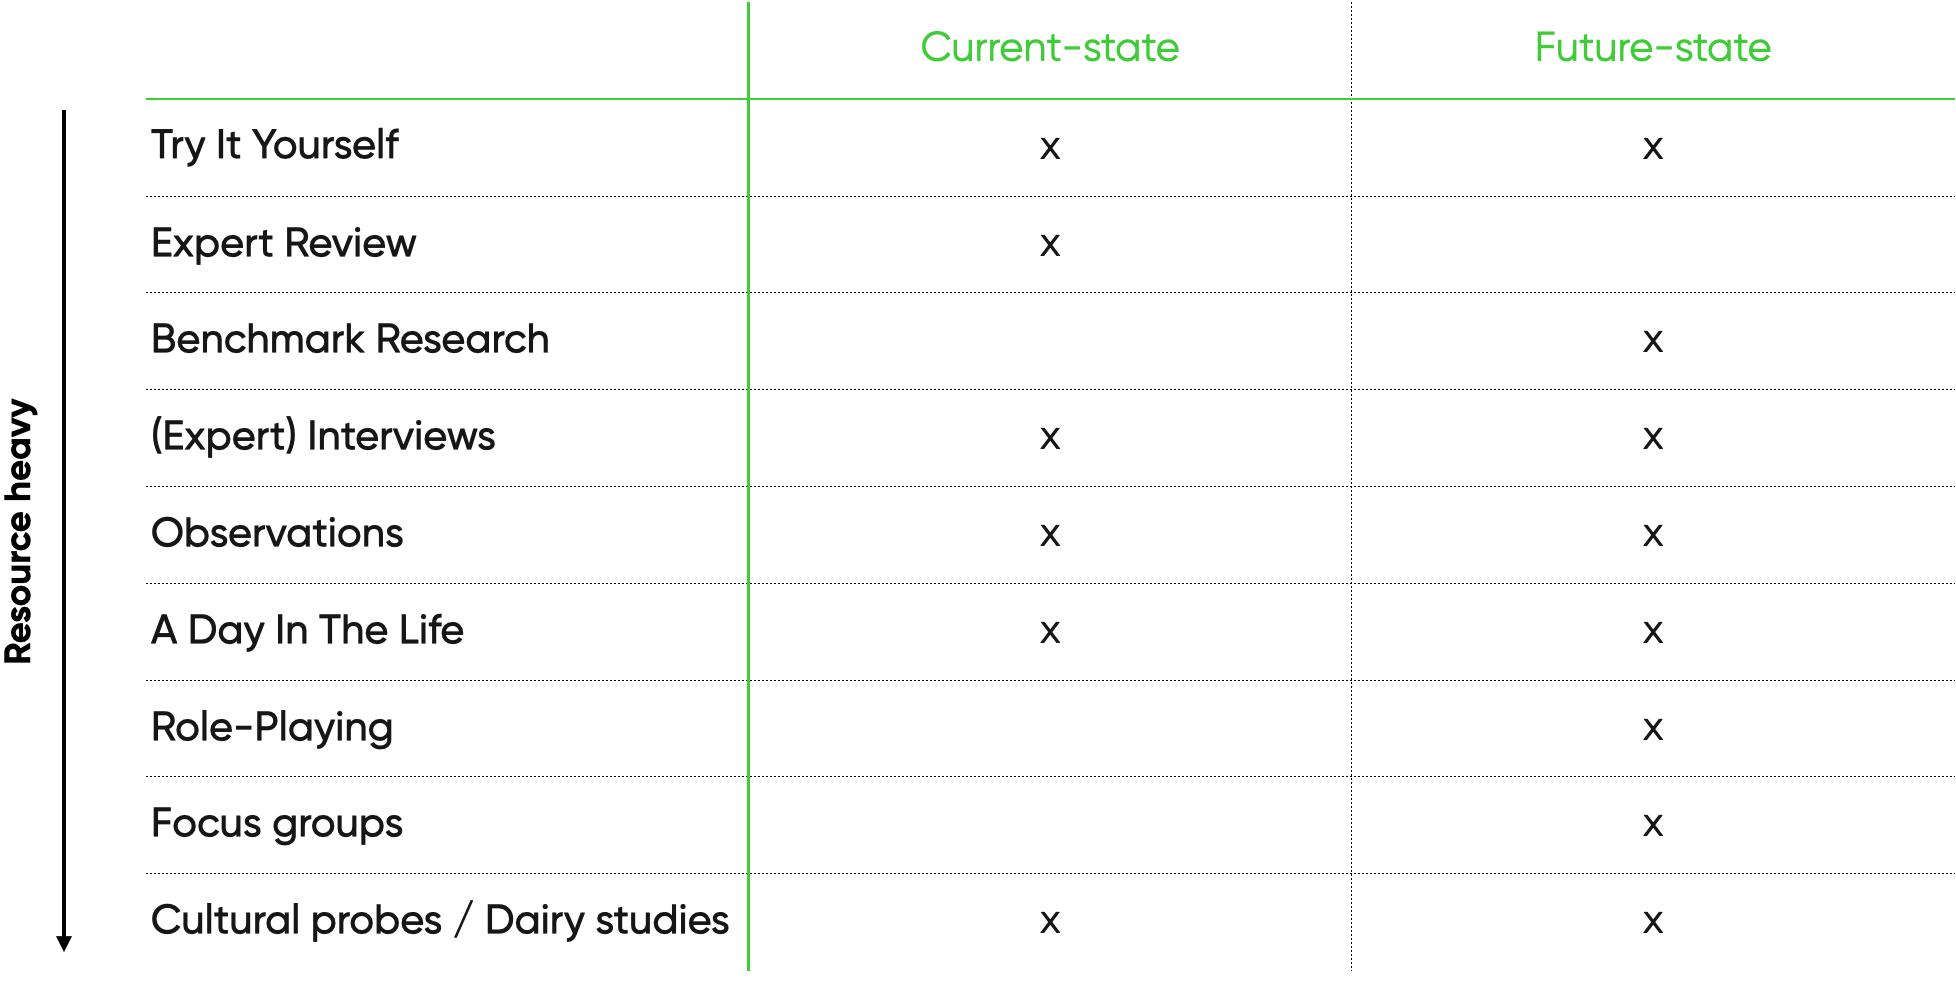
Data collection
Before you can craft your journey map, you need to gather data to base it on. Depending on how much resources you have, you can mix and match these sources and methods of data collection. However, don't overdo it. Let the lens help you to make sure your data collection efforts don't get out hand.
- What the client might provide
- Marketing research
- Performance metrics
- Earlier research reports
- Persona's
- Mission/vision/KPI's
- et cetera
- Research you can do yourself depends on your resources and the type of map you are making.
Step 2: Synthesis
In this step you take all your data points and combine them in a unified, research-based theory represented in a journey map. As stated in Decision 1 this can be done in two ways:
- Workshop synthesis with stakeholders
- Desk synthesis with co-researchers/designers
However the following steps are more or less the same:
Analyse qualitative data
The goal of this step is to make sense of the data you have collected and emerge with clusters that offer insight into the journey you are trying to capture.
- Gather all the observations (physical or digital)
- Highlight recurring observations
- Select (interpret) which observations are meaningful. You can capture the interpretation by creating statement cards that contain the observation and the interpretation.
- Cluster the selected observations/statement cards.
Build the journey
Finally you are now ready to create the journey. You can do this yourself by using the analysed data from the previous step, or you can do this together with your stakeholders by doing a workshop. Luckily you have already made this Decision 1.
Desk synthesis
Do this when you want a thorough analysis of the journey
- Use the clusters and insights from the previous step, and plot them on the journey map
- Use the emotion curve as a summary of the insights you plot on the map
- Add quotes, video clips and other real life content to make the map 'come to life'
Group synthesis
Do this when you want get a quick overview or want to create a future state of the journey.
- Draft a journey map before the workshop to see what the result might look like
- Decide on the lens and align that with your main stakeholder
- Decide on the phases and the rows you want to incorporate in the journey and align on that with your main stakeholder
- Make sure the right stakeholders are invited to the workshop, that they know the purpose of creating the journey map and if there is any preparation you expect them to do. When choosing stakeholders, check if you have all the expertise present to fill every row you have defined.
- Create the template for the journey and gather all the supplies needed to fill it. Make sure there is room for at most 18 steps (more steps complicates things too much)
- Digital: Miro or Mural work well, but in a pinch you can also get creative with a collaborative office suite from Google or Microsoft
- Physical: Brown paper, post-its (one color per row), dot-votes, enough markers, tape to hang the brown paper, a time-timer to keep yourself to the schedule.
The actual workshop works as follows:
3. Let your main stakeholder repeat the purpose of the workshop and repeat the expectations you have from everyone
2. Present the Lens and the phases to make sure everyone understands the scope
3. Make each participant responsible for a row (meaning that they write the post-it's and make sure we don't miss anything for their row). This keeps them engaged, frees you up to facilitate and keep things going. Match the rows with their respective expert stakeholders.
4. Start at the beginning with phase 1 and ask what actions the user takes in that phase. From there work your way down rows for that phase. Then move on to the next phase until you reach the end. It is okay to jump back and forth every once in a while to check for internal consistency.
With large maps or little time, it can help to pick just a few phases to focus on
5. Let the participants study the map and write post-its with opportunities in silence
6. Then prioritise the opportunities by letting the participants dot-vote.
7. (optionally) Assign ownership of the top voted opportunities amongst the stakeholders, or jump into the ideation phase of the design process with the top voted opportunities. You can also do this after you have detailed/validated the map.
8. Enrich the map with more detail if needed. You can either do this with the research you have already gathered or treat the map as a hypothesis that you can validate/falsify with additional research.
Step 3: Delivery
Depending on your situation you might need to provide the client with the map as a deliverable. There are a few choices here.
Living map
If there is a need for an up to date map and there are resources available to maintain it, you can opt for a living map. Use services such as TheyDo and Smaply to digitize the journey in a maintainable format (find a comparison of tools here). You can also use Figma or Miro as a more flexible tool, although they are a bit harder to maintain.
One off
If this map is made for a special one-time purpose, then there is no need to force fit it into a specific tool. You can create a map that tells the story in exactly the way you want it to, complete with the specific nuance that is needed. Hand-over a PDF or a physical poster when you are finished.
Tips
- You can use a proto-journey in which you capture the assumptions you and your team have as a starting point or to organise the info you get at the start of a project. This proto-journey can then be used to validate your assumptions during user research or with stakeholders.
- No more than 18 actions per journey or it becomes too complicated to convey meaning.
- Draft the map before going into the workshop.
- Make every participant responsible for filling in a row
- Creating the map together with stakeholders gives them a feeling of ownership.
- If the journey map is not needed as a presentation tool or to convince stakeholders, try to “keepit ugly”. The content is most important, and it saves time not having to make an extensive infographic.
Tooling
Tools to create and manage customer journey maps, service blueprints, roadmaps, etc
1. Miro
Miro is an online whiteboard tool, it works great for remote teams that want to organize their thoughts during a workshop. It works intuitively, so this tool is perfect for stakeholders that are less tech-savvy but still need to contribute towards the journey map. There are some pre-made templates from Miro to create a journey map.
Pros:
- Easy to work with
- Good option for workshops
- Wide customization options
- Templates available
Cons:
- Limited design options for final deliverable
2. Figma
Figma is a collaborative interface design tool, it also works great for remote teams that want to work together. It’s more difficult for stakeholders without prior experience to work with, therefore it is less suitable for workshops. Figma is still a design tool, so you can easily customize the journey map however you want, it might be more time-consuming as you need to create everything from scratch.
Pros:
- Wide design options
- Wide customization options
- You probably know this tool already
Cons:
- Time-consuming
- Less suitable for stakeholders
3. TheyDo
TheyDo is a customer journey management tool. It is a tool designed specifically to create journey maps, therefore there are templates for customer journey maps, service blueprints, strategic roadmaps, etc. This makes it easy to get started designing journey maps since you don’t have to start from scratch. The customization is limited as it is a customer journey tool and not a design tool, but most options needed for journey maps should be available. The information inside the journey map is very organized as you can click on data points to show more information, this way you can store a lot of information inside your journey map while keeping a good overview.
Pros:
- High quality templates for different journey maps
- Guides and tutorials to boost your research
- Organized information overview
Cons:
- Limited customization
- Opinionated about what personas and customer journeys should look like
- Vendor lock-in: you can’t get the full experience outside of TheyDo
\
Learn more
- Templates and examples (Hike One)
- Journey Mapping Masterclass from Hike One Academy
- The User's Journey on A List Apart
- Design for Real Life on A List Apart